Cracking the Code: Is Bozeman’s Zoning Restrictive?
The logic behind the policy of blanket up-zoning runs as follows. Zoning limits housing production by restricting the quantity of housing units that can be built on zoned parcels. The lower supply than would otherwise prevail means that the markets for rental and owner-occupied homes clear at higher prices than they would in the counterfactual scenario. Further, zoning restrictions on housing forms leave certain housing forms simply unavailable over wide geographic areas, forcing households to consume types of housing that don't suit -- for example, a person wants to live in a given part of a city, but must live in a too-large house rather than a just-right apartment. The question of whether up-zoning a particular neighborhood or town will have positive effects of a meaningful magnitude on housing affordability and choice has garnered a great deal of hot debate. In technical terms, what the up-zoning thesis claims is that overly restrictive zoning reduces the elasticity of housing supply. Rising home prices create profitable opportunities (ex-land) to build housing, but developers cannot capitalize on those opportunities because zoning does not permit it. For any given rise in home prices above production costs, less supply results than would under the same demand conditions and looser zoning. We intend to address that more general debate in another post. It is a quite complicated question, much more so than those who like to chant that "it's just Economics 101, supply and demand!" will credit. For the purposes of this post, though, we will assume, arguendo that the upzoning thesis has merit.
Instead, we want to consider the question of whether Bozeman specifically suffers an important zoning-mediated distortion in housing supply. Up-zoning purports to be an efficacious "treatment" for the "disease" of low housing affordability due to suppressed production. But even the most ardent up-zoner would agree that not every jurisdiction suffers from this disease, and that not all jurisdictions that do suffer from it do so to the same degree. Even if all doctors concur that chemotherapy is indicated for cancer, the first step is to diagnose the malady. We don't dose patients with chemotherapy unless the patient actually has cancer. Like chemotherapy, up-zoning inflicts side effects. While in certain places and eras, policy-makers have used zoning for ulterior motives -- perhaps even to support high housing prices! -- zoning also performs important, licit functions, such as separating incompatible uses and allowing jurisdictions to pace growth to match infrastructure. Removing zoning controls interferes with those functions, so it is not a treatment that is costless and riskless to administer.
How do we measure if our zoning is restrictive?
To answer the question, we can look at the zoning code directly or indirectly, via considering whether we see patterns of development consistent with a supply restriction from zoning. In this post, we will take the first approach, while we will look at the issue from the second perspective in a subsequent post. Compared to a sample of college towns, Bozeman’s zoning looks relatively permissive on several key metrics.
How, then, does one establish whether a jurisdiction has zoning sufficiently restrictive and distortive to cause housing affordability problems and dearth of choice among housing forms? Broadly, we can take two approaches. First, we can examine features of the code directly. How do quantifiable provisions in the code compare to the same criteria in other jurisdictions? Second, we can look for symptoms of overly restrictive zoning that might appear in other data relating to housing. We will take that approach in a subsequent blog post.
Citizens for Responsible Planning, a Charlottesville-based group that has done a great deal of research on zoning reform and zoning restrictiveness, has published data comparing the zoning of a sample of "college towns" across the US. They included Bozeman in their data set. The data looks at a few important dimensional criteria for the cities and towns in the sample. They compare "urban R-1" zoning (1) -- that is, they exclude low-density zoning districts that may be more rustic/rural in character. This makes the comparisons to Bozeman if anything generous, since several of these cities have zoning districts that are substantially more restrictive than the results in the charts. First, let's look at minimum lot size (in square feet). It is a particularly important variable to consider, because it is one of the only variables in the literature where one can detect more than a de minimis correlation between looser (larger minimum lots size) rules and home prices (though magnitude of effect is still fairly small) (2).

Bozeman comes in at the very low end of the sample. In fact, the city's minimum lot size remains lower than in Charlottesville's even after that city passed what has been characterized as one of the most aggressive zoning reforms in the country (drafted by Code Studio, the same firm hired to write Bozeman's UDC, which shows evidence of the city having paid for a lot of "copy-paste" from Charlottesville's project!).
Now, we consider maximum heights in the same zoning districts.

Once again, Bozeman comes in toward the more permissive end of the scale. Only Manhattan, Bloomington and Ann Arbor have higher maximum heights.
The last dimensional criterion we consider is minimum lot width.

Bozeman sits in the middle of the pack on this metric, slightly above what seems to be a pretty strong mode at 35 feet. On the key dimensional criteria, Bozeman's clearly counts as one of the more permissive zoning codes.
Finally, we consider a metric that gets cited very frequently by proponents of upzoning, but which we do not believe has particularly strong explanatory power for housing outcomes: the percentage of land that is zoned as what people colloquially refer to as "R-1", by which they mean land zoned for no other by-right residential use than single-family housing (with or without ADU entitlement). We reproduce CFRP's chart on this from 2022 (see the original research, which also goes into why R-1 fraction does not have the explanatory power people tend to think, here). The chart describes what percentage of land in districts with at least some residential by-right uses can only be used by-right for SFH.
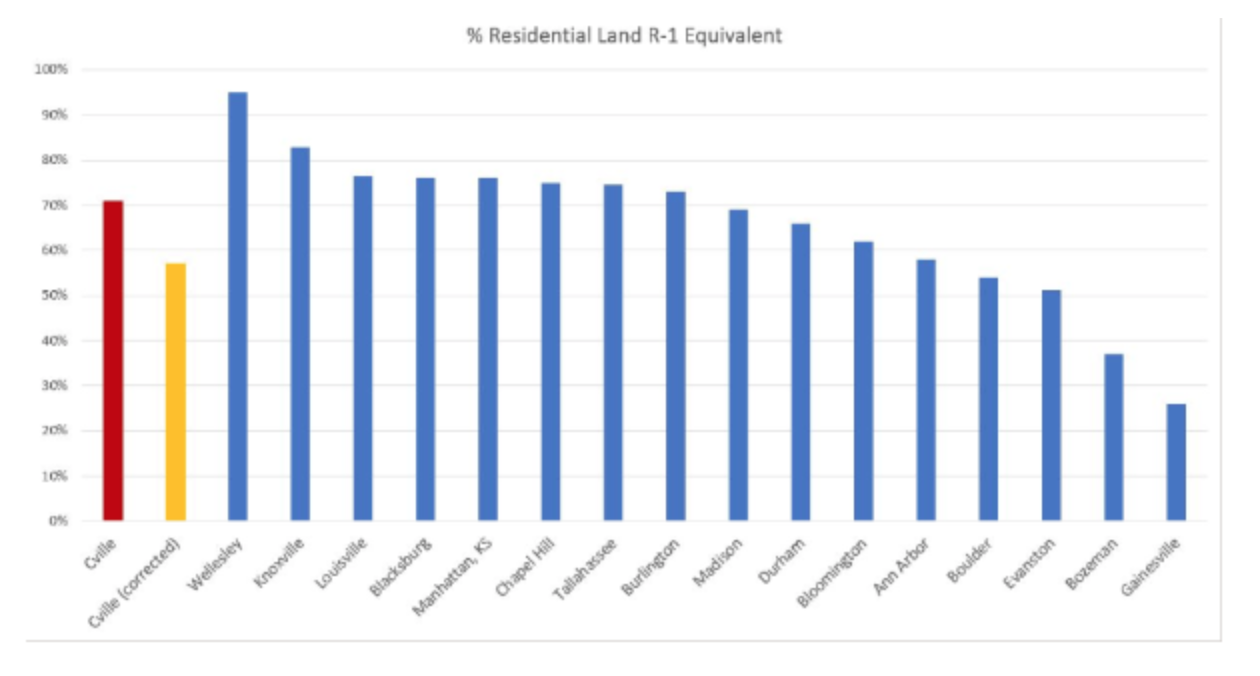
Bozeman comes in at the second-lowest in the sample. It is worth noting that when we calculate this parcel-by-parcel across all of the city (excluding parks, roads, water), the percentage of total parcel area under SFH-only zoning districts (R-S/R-1), we only get to 17%! Hardly the picture of a place that ruthlessly suppresses multi-family housing, if you buy into the YIMBY emphasis on the importance of "R-1". A further illustration comes from mapping all the parcels in Bozeman zoned R-1 and either containing only single-family detached housing or lying vacant. You hardly see a Palo Alto or Scarsdale-like picture of a sea of R-1 surrounding tiny islets of higher-intensity zoning.

R-1 with only a single family detached home, or vacant
Beyond Campus-land: Evidence from Larger Datasets
A number of studies have attempted to create indices of land use regulation restrictiveness. We can use their databases to compare Bozeman’s zoning to literally thousands of jurisdictions on the specific, tracked metrics. We find again that Bozeman’s code lies at the less restrictive end of the range on most of the tracked variables.
While it is useful to look at these few discrete facets of zoning ordinances in a set of college towns like Bozeman, it is also true that a zoning ordinance is more complex and multifaceted than what three or four metrics can capture. It is also desirable to look at a wide sample of jurisdictions. Yet, it proves quite cumbersome to collect data on multiple metrics for hundreds or even thousands of zoning jurisdictions! Fortunately, a number of academic studies have tried to develop methods of quantifying land use restrictiveness, starting with the Wharton Residential Land Use Restrictiveness Index(3). Now, the WRLURI, as well as the other indices that have followed in its footsteps, suffers from some serious problems. The biggest is that the attempt at dimension reduction -- to reduce "restrictiveness" to a single statistic -- is fraught with difficulties(3). Moreover, these indices do not look strictly at zoning but rather at land use policies more broadly. That said, the work of the index-makers can still be of use to us, because they did collect standardized data points on many zoning variables for a broad set of jurisdictions.
First, let's look at how Bozeman compares to the 2018 WRLURI sample on its zoning subindices. The WRLURI data comes from surveys sent out to the land use officials of thousands of jurisdictions. The answers may not align exactly with code (even land use officials are fallible with respect to their knowledge of local regulations!). At least some data came back from close to 3000 jurisdictions. We compare Bozeman on each subindex to the sample mean and the 25th and 75th percentile of responses. Some of the variables have only a few discrete values, so we felt like it was important to show it both ways. For all WRLURI subindices, a higher score means more restrictive rules.

Wharton Residential Land Use Restrictiveness Index, 2018 WRLURI. A higher score means more restrictive rules.
Bozeman does not appear to have unusually restrictive zoning rules in the context of the WRLURI sample, with nearly all the measures falling in the 2nd or 3rd quartiles. The main exception is the Average Delay Index, which runs longer in Bozeman than many other jurisdictions. Bozeman comes in at the 83rd percentile. The ADI looks at average approval time for a variety of types of requests. When we drill down, we see that Bozeman's "restrictive" performance on this index is driven by one particular segment.

Approval times for rezoning applications
Bozeman approves by-right projects of all sizes and types relatively rapidly. As this reflects base zoning, it is the assessment most relevant to understanding how expeditiously projects under the base zoning can go forward. Bozeman does well on this score. The problem is that Bozeman is an outlier on the approval of rezonings. Interestingly, though, it is the slowest on rezoning of large single-family project rezonings. The city comes in much quicker on multi-family rezonings, which undermines the narrative of a regulatory framework hostile to multifamily development. Overall, Bozeman looks like a fairly average jurisdiction in terms of zoning permissiveness, and more permissive than average on written code, seeing as its poorest performance comes exclusively on timeliness-of-approval metrics, particularly for large SFH rezonings.
Now we perform the same exercise using the data from Mleszco and Desmond's 2023 attempt at quantifying land use restrictiveness for a large sample of jurisdictions(5). Unlike the WRLURI, this research relies on AI processing of raw zoning texts available online. It captures data on 2,640 jurisdictions. Note that for some of the metrics, a lower number represents more permissive zoning and in others a higher number does. We note when the latter is the case. Again we focus on the zoning-specific metrics.

Mleszco and Desmond 2023 zoning metrics
We can see that on the metrics from this study, some of which overlap with those included in the WRLURI, Bozeman zoning looks relatively permissive. On no metric does Bozeman rank as less permissive than average. And on a few metrics the city comes out at the high-end of permissiveness, for example in terms of the percentage of land that has a by-right non-SFH residential use (Bozeman is at the 92nd percentile of the sample).
“Housing Crisis” is a Symptom, Not a Diagnosis
Housing in Bozeman has become over the past decade much more difficult for the average resident to afford. That is an empirical observation, not a theory of causation. To find the right treatment, we need to be sure of the pathology underlying the symptom.
Much as in other jurisdictions contemplating zoning reform, in Bozeman the impetus for zoning changes comes from abrupt and startling increases in housing prices and concomitant deterioration in housing affordability. But increases in housing prices and decreases in affordability no more prove that zoning is overly restrictive than having nasal congestion and a fever proves a person has COVID. It is generally best practice to try to make a diagnosis to inform treatment rather than to treat based on a guess supported by one or two symptoms. A direct examination of Bozeman's zoning code does not show signs of excessive restrictiveness relative to other jurisdictions. It ought to be incumbent on those advocating a particular treatment -- one with the undeniable potential for deleterious side-effects -- to make a convincing case that the treatment addresses the true underlying malady. So far, Bozeman's advocates have only demonstrated that housing in the city has become more expensive and reached a level where affordability challenges are acute for many residents. They have not shown the reason for it is zoning or that zoning changes will make a meaningful contribution to solving the problem. A fortiori, then, they have not shown that the cause is very specifically that zoning does not enable sufficient residential density. We want to avoid a situation where the city gets all the side effects of a radical treatment and none of the purported benefits because the treatment is misdirected!
At the outset, we mentioned two approaches to diagnosing severe zoning-mediated supply restriction. In this post, we looked at the zoning code directly. The other approach involves looking for indicia of restriction. In essence, we ask ourselves what phenomena will likely manifest in a jurisdiction where supply is artificially throttled by restrictions and then we examine those phenomena for which data is available. Look for our next post for details on this part of the analysis!
Author Benjamin Heller, Bozeman Resident
Footnotes:
(1) The analysis started by looking at the lowest-density category. If the zoning map showed that category exists mostly outside the core of the urban area of the jurisdiction, it was thrown out, and the analysis moved up to the next district in the ordering of districts from the least to most intense, until a truly urban district was reached. In the case of Bozeman, we threw out R-S and looked at R-1, though they don't differ much on the criteria of interest.
(2) for example, see Song, Jaehee, The Effects of Residential Zoning in U.S. Housing Markets (April 2024). Song finds a doubling of miminum lot sizes is associated with, controlling for building characteristics, an increase in home prices of 2.2%. For rents, and without controls for building characteristics, the impact is 13%.. Applicability to Bozeman is dubious, since the city’s largest minimum lot size by zoning district is below the 5th percentile of minimum lot sizes in Song’s sample. Halving minimum lot size from 4000sf to 2000sf would almost surely have less of an effect that halving minimum lot size from the US sample median of 9,200sf
(3) See Gyourko, Joseph E. ,Saiz, Albert and Summers, Anita A., A New Measure of the Local Regulatory Environment for Housing Markets: Wharton Residential Land Use Regulatory Index (October 13, 2006); and Gyourko,Joseph E., Hartley, Jonathan and Krimmel, Jacob,, The Local Residential Land Use Regulatory Environment Across U.S. Housing Markets: Evidence from a New Wharton Index (December 2019)
(4) The approach taken by most index makers is to apply principal components analysis (PCA) to a set of land use policy variables (sometimes taken from the code, sometimes based on surveys of policymakers) and to define the land use restrictiveness index as the jurisdiction's score on the first principal component. The problem is that when we replicate these papers, we find that the loadings for variables often have the wrong sign, i.e. the opposite of sign theory would predict.. For example, a higher permitted maximum height in one paper meant a more restrictive index score. Further, the first principal component often explains only a small portion of overall variance. Finally, the authors of these papers often tend to abuse PCA -- for example, mixing dichotomous and continuous variables in the analysis. Sadly, the methodological rigor in the housing economics space leaves, in our experience, much to be desired.
(5) See Mleczko, Matthew and Desmond, Matthew, Using natural language processing to construct a National Zoning and Land Use Database (2023)